
3 posts tagged with "dbt runner"

View All Tags

· 7 min read
Dylan Hughes & Chris Reuter

This article is reposted from Prefect.io blog, and you can read the original there.

The hardest part about writing a blog is getting started - writing the outline and filling out the first few key points. The same can be said for writing data pipelines: you need to inspect docs, determine data structures, write tests, etc.

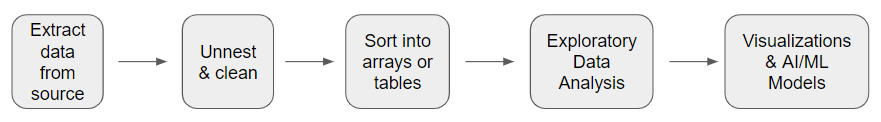
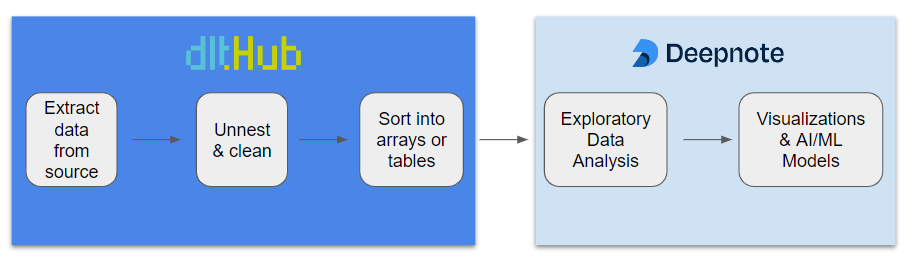
What if you could build a resilient, production-ready data pipeline that is scheduled and running in just a few minutes? We’ll show you how to do just that with dlt and Prefect.

dlt

dlt is an open-source library that you can add to your Python scripts to load data from various and often messy data sources into well-structured, live datasets. It abstracts away the need to hunt through docs, interpret APIs, and reinvent the wheel every time. Instead of writing a custom pipeline, you can use dlt to build a framework for your pipelines for any combination of tools.

Moving Slack data into BigQuery

We use BigQuery as our data warehouse, and try to centralize as much information there as possible. Given our Slack community is over 25,000 people, it makes sense to use that information to better our community. We can identify the types of questions our users struggle with the most, and take action to improve Prefect by using Slack data.

If you Google “load Slack into BigQuery,” you’ll see a bunch of listings for no-code tools like Zapier that can help you move data… for a fee, of course. What if you want to do this yourself? Slack has an API, but check it out. It would take some effort to interpret even a simple response like this one for users:

{
"ok": true,
"members": [
{
"id": "W012A3CDE",
"team_id": "T012AB3C4",
"name": "spengler",
"deleted": false,
"color": "9f69e7",
"real_name": "spengler",
"tz": "America/Los_Angeles",
"tz_label": "Pacific Daylight Time",
"tz_offset": -25200,
"profile": {
"avatar_hash": "ge3b51ca72de",
"status_text": "Print is dead",
"status_emoji": ":books:",
"real_name": "Egon Spengler",
"display_name": "spengler",
"real_name_normalized": "Egon Spengler",
"display_name_normalized": "spengler",
"email": "spengler@ghostbusters.example.com",
"image_24": "https://.../avatar/e3b51ca72dee4ef87916ae2b9240df50.jpg",
"image_32": "https://.../avatar/e3b51ca72dee4ef87916ae2b9240df50.jpg",
"image_48": "https://.../avatar/e3b51ca72dee4ef87916ae2b9240df50.jpg",
"image_72": "https://.../avatar/e3b51ca72dee4ef87916ae2b9240df50.jpg",
"image_192": "https://.../avatar/e3b51ca72dee4ef87916ae2b9240df50.jpg",
"image_512": "https://.../avatar/e3b51ca72dee4ef87916ae2b9240df50.jpg",
"team": "T012AB3C4"
},
"is_admin": true,
"is_owner": false,
"is_primary_owner": false,
"is_restricted": false,
"is_ultra_restricted": false,
"is_bot": false,
"updated": 1502138686,
"is_app_user": false,
"has_2fa": false
}
]
}

With dlt

You can use dlt to build a Slack to BigQuery pipeline in just a few seconds with a single command. Seriously, it is that simple. In preparation, let’s make sure to install what we need:

pip install dlt
pip install prefect

Then just run a simple init command:


dlt init slack bigquery

In the .dlt/secrets.toml file, enter your Slack and BigQuery credentials:

[sources.slack]
access_token="*****"

[destinations.bigquery]
location = "US"

[destination.bigquery.credentials]
project_id = "*****"
private_key = "*****"
client_email = "*****"

With a single command + adding some credentials, we now have the framework of a pipeline! Look at what has been generated, with a couple of small customizations:

Note that we are redacting some of the code in the preview for brevity, to follow along completely navigate to the repo.

# Pipeline to load Slack into BigQuery

from typing import List

import dlt
import pendulum

from slack import slack_source

def load_channels() -> None:
"""Execute a pipeline that will load a list of all the Slack channels in the workspace to BigQuery"""
# ...

def get_resources() -> List[str]:
"""Fetch a list of available dlt resources so we can fetch them one at a time"""
# ...

def load_channel_history(channel: str, start_date: Date) -> None:
"""Execute a pipeline that will load the given Slack channel incrementally beginning at the given start date."""
# ...

def get_users() -> None:
"""Execute a pipeline that will load Slack users list."""
# ...

if __name__ == "__main__":
channels = None
start_date = pendulum.now().subtract(days=1).date()

load_channels()

resources = get_resources()
for resource in resources:
if channels is not None and resource not in channels:
continue

load_channel_history(resource, start_date=start_date)

get_users()

What if it fails?

Great, we’ve got a pipeline that moves data from Slack to BigQuery, and we didn’t have to format any JSON - that alone is a win. However, there may be some issues. What if Slack rate limits you? What if BigQuery is down (😅)? What about a networking issue? What if the execution environment where this script lives isn’t working?

These questions are the difference between a pipeline and a resilient pipeline. They’re the difference between you getting sleep at night and you looking like a hero (or a dummy) to your stakeholders.

Adding Prefect

Prefect is a workflow orchestration tool for turning your pipelines into scheduled, repeatable, and resilient workflows. With Prefect you get scheduling, observability, and automations that can make sure your pipelines aren’t causing you stress in the middle of the night.

Make sure you’re logged in to Prefect Cloud by signing up and using the following command:

prefect cloud login

Luckily, Prefect is also incredibly Pythonic. Turning any pipeline into an observable, scheduled Prefect flow is as simple as adding decorators to your functions and serving it up. Here’s our dlt generated pipeline, scheduled daily:

from typing import List

import dlt
import pendulum
from prefect import flow, task
from slack import slack_source

@task
def load_channels() -> None:
...

@task
def get_resources() -> List[str]:
...

@task
def load_channel_history(channel: str, start_date: pendulum.Date) -> None:
...

@task
def get_users() -> None:
...

@flow
def slack_pipeline(
channels=None, start_date=pendulum.now().subtract(days=1).date()
) -> None:
load_channels()

resources = get_resources()
for resource in resources:
if channels is not None and resource not in channels:
continue

load_channel_history(resource, start_date=start_date)

get_users()

if __name__ == "__main__":
slack_pipeline.serve("slack_pipeline", cron="0 0 * * *")

We’ve added @task to our individual functions. These will be treated as individual units of work by Prefect when they are executed. We decorate our primary function (slack_pipeline) with @flow, which references our task functions. We will schedule and kick off flows, which in turn will execute tasks based on the decorators within them.

Finally, adding .serve to our if __name__ == "__main__": call means that a Prefect deployment will be automatically created and scheduled to run daily at noon. We can see our deployment and scheduled runs in the Prefect UI, and we’ll know when it ran or, more importantly, if they didn't. We can further extend our pipeline by:

Where to handle failure

There are many levels of failure, you could say, from "accidentally liking your ex's social media post from five years ago" to "trying to assemble IKEA furniture without instructions," up to "asking for the Wi-Fi password at a funeral." So which ones should we handle where, and what are some quick solutions?

With dlt, your pipelines are resilient at the API level. From schema changes to network issues or memory overflow, there is automated resiliency and recovery that is specific to working with the pesky APIs of your tools.

With Prefect, your pipelines become resilient at the function level. If your workflows never run, break and fail, or break and never end, Prefect will be your backstop - notifying you and taking the appropriate action in case of failure.

Building resilient pipelines faster with dlt + Prefect

Getting into production is hard. First you need to build your pipeline, and then you need to make it resilient. With this tutorial, we’ve shown you how to quickly build pipelines with dlt and then turn that pipeline into a resilient, repeatable workflow with Prefect.

Prefect makes complex workflows simpler, not harder. Try Prefect Cloud for free for yourself, download our open source package, join our Slack community, or talk to one of our engineers to learn more.

· 12 min read
Hiba Jamal

What’s in this article:

  1. ⌛The Problem; The bulk of time spent in a data science project is on the transformation of data itself.
    1. The usual flow of data for data science projects
    2. A peak into the datasets 👀
  2. ⚰️The Classical Solution; using pandas to model complicated data for your analytics workflows isn’t the fastest way out.
  3. 💫The Revised Solution; Revisualizing the flow of data with dlt & Deepnote
    1. Introducing dlt; the data cleaner I wish I had
    2. Deepnote - the iPython Notebook turned Dashboarding tool
  4. 🌍Clustering countries based on their wellness indicators
  5. 🔧Technical Conclusion; dlt & Deepnote are the data science dream team
  6. 🎆Analytical Conclusion; Leave women in dangerous situations for extended periods of time and they’ll begin to justify the violence committed against themselves!

⌛The Problem; The bulk of time spent in a data science project is on the transformation of data itself.

If you are a data analyst, data scientist or a machine learning engineer, then more likely than not, you spend more time fixing data pipelines or data formats then you do on ML algorithms or dashboard designs. We aren’t always lucky enough to get structured data to work with. Imagine a world where your training data is just this statement without no prior work:

select * from <dataset_table>

What a world that would be.

Unfortunately, before we get to writing this select statement, we need to go through some very important but time consuming first steps. To describe what this journey looks like, let’s list down the steps we usually undergo.

The usual flow of data for data science projects

usual flow

We sign up for our jobs because we enjoy the last two activities the most. These parts have all the pretty charts, the flashy animations, and, if the stars align, include watching your hunches turn out to be statistically significant!

However, the journey to reach these stages is stretched much longer due to the time spent on data formats and pipelines. It would be such a load off my mind if they would get sorted themselves and we could skip to the good part. Sure, ipython notebooks with pandas and numpy help us in getting along, but what if there was something even simpler? Let’s explore different solutions.

A peak into the datasets 👀

The two datasets that we are using are nested json files, with further lists of dictionaries, and are survey results with wellness indicators for women. Here’s what the first element of one dataset looks like:

Looks like it is a nested json, nested further with more lists of dictionaries.

⚰️The Classical Solution; using pandas to model complicated data for your analytics workflows isn’t the fastest way out.

Usually, json_normalize can be used to unnest a json file while loading it into pandas. However, the nested lists inside dictionaries do not unravel quite well. Nonetheless, let’s see how the pandas normalizer works on our dataset.

Conclusion from looking at the data: pandas successfully flattened dictionaries but did not unnest lists. Perhaps because in order to unpack these lists, one might need to create new tables, essentially create a data model entirely. But, that is something pandas does not do for us. So, to be able to use it, let’s flatten the data further into arrays and tables. Particularly, let’s pay attention to the amount of code required to achieve this task.

To start off, using the pandas explode function might be a good way to flatten these lists:

And now, putting one of the nested variables into a pandas data frame:

And this little exercise needs to be repeated for each of the columns that we had to “explode” in the first place.

Our next step could be using a visualization package like matplotlib, and other pandas and numpy based functions to conduct a thorough exploratory analysis on the data. However, if we use the code above and plot two variables against each other on a scatter plot, for example, marriage_related and work_related, then joining this data wouldn’t be simple. We would have to be wary of the list indices (or something that can be used as foreign keys) that will match rows together across different tables. Otherwise, we would end up with mismatched data points on the scatter plot. We’ll get more into this in the Know your data model section.

💫The Revised Solution; Revisualizing the flow of data with dlt & Deepnote

We can reimagine the flow of data with dlt and Deepnote in the following way:

revised flow

We leave the loading of the raw data to dlt, while we leave the data exploration and visualization to the Deepnote interface.

Introducing dlt; the data cleaner I wish I had

Imagine this: you initialize a data pipeline in one line of code, and pass complicated raw data in another to be modelled, unnested and formatted. Now, watch that come to reality:

And that’s pretty much it. Notice the difference in the effort you had to put in?

The data has been loaded into a pipeline with duckdb as its destination. duckdb was chosen as it is an OLAP database, perfect for usage in our analytics workflow. The data has been unnested and formatted. To explore what exactly was stored in that destination, a duckdb connector (conn) is set up, and the SHOW ALL TABLES command is executed.

In a first look, we understand that both the datasets violence and wellness have their own base tables. One of the child tables is shown below:

Know your data model; connect the unnested tables using dlt’s pre-assigned primary and foreign keys:

The child tables, like violence__value or wellness__age_related are the unnested lists of dictionaries from the original json files. The _dlt_id column as shown in the table above serves as a primary key. This will help us in connecting the children tables with ease. The parent_id column in the children tables serve as foreign keys to the base tables. If more then one child table needs to be joined together, we make use of the _dlt_list_idx column;

Deepnote - the iPython Notebook turned Dashboarding tool

Take your average Notebook experience, and combine it with the powers of a collaborative and interactive dashboarding tool and you get Deepnote. Now that we focus on analytics portion of this article, let’s check out how Deepnote helps along the way.

One step visualizations

At this point, we would probably move towards a plt.plot or plt.bar function. However, with Deepnote, the little Visualize button on top of any data frame will help us jump straight to an easy figure. Clicking on the Visualize button takes you to a new cell block, where you can choose your parameters, types of charts, and customization settings in the sidebar. The following chart is built from the joined data frame we defined above.

chart

And a stacked bar chart came into existence! A little note about the query results; the value column corresponds to how much (in %) a person justifies violence against women. An interesting yet disturbing insight from the above plot: in many countries, women condone violence against women as often if not more often than men do!

The next figure slices the data further by gender and demographic. The normalized bar chart is sliced by 2 parameters, gender and demographic. The two colors represent genders. While different widths of the rectangles represent the different demographics, and the different heights represent that demographic’s justification of violence in %. The taller the rectangle, the greater the % average. It tells us that most women think that violence on them is justified for the reasons mentioned, as shown by the fact that the blue rectangles make up more than 50% of respondents who say ‘yes’ to each reason shown on the x-axis. If you hover over the blocks, you will see the gender and demographic represented in each differently sized rectangle, alongside that subset’s percentage of justification of violence.

Let’s examine the differences in women’s responses for two demographic types: employment vs education levels. We can see that the blue rectangles for “employed for cash” vs “employed for kind” don’t really vary in size. However, when we select “higher” vs “no education”, we see that the former is merely a speck when compared to the rectangles for the latter. This comparison between employment and education differences demonstrates that education plays a much larger role in likelihood to influence women’s levels of violence justification.

Let’s look at one last plot created by Deepnote for the other dataset with wellness indicators. The upward moving trend shows us that women are much less likely to have a final say on their health if they are less educated.

🌍 Clustering countries based on their wellness indicators

Lastly, based on these indicators of wellness and violence about women, let’s use KMEANS to cluster these countries to see how the algorithm groups which countries together. The intersection of the ‘countries’ columns in both datasets results in the availability of data for 45 countries. The columns used in this model indicate per country:

  • the average years of education for women

  • % of women who have a final say over their health matters

  • % of women who have control over their finances

  • % of women working

  • % of violence justification

    Within these countries, the KMEANs algorithm converges to 4 clusters.

clustering

The color bar shows us which color is associated to which cluster. Namely; 1: purple, 2: blue, 3: green, and 4: yellow.

To understand briefly what each cluster represents, let’s look at the averages for each indicator across all clusters;

This tells us that according to these datasets, cluster 2 (highlighted blue) is the cluster that is performing the best in terms of wellness of women. It has the lowest levels of justifications of violence, highest average years of education, and almost the highest percentage of women who have control over their health and finances. This is followed by clusters 3, 1, and 4 respectively; countries like the Philippines, Peru, Mozambique, Indonesia and Bolivia are comparatively better than countries like South Africa, Egypt, Zambia, Guatemala & all South Asian countries, in regards to how they treat women.

🔧Technical Conclusion; dlt & Deepnote are the data science dream team

It is safe to say that dlt is a dream come true for all data scientists who do not want to 1. Wait for a data engineer to fix data pipeline issues and model discrepancies, or 2. Spend time studying the format of a dataset and find ways to structure and unnest it. The library supports many different sources and can pick up the dreadful data cleaning tasks you don’t want to do.

Next, let’s talk about the coding tool of choice for this article—Deepnote. With code blocks that come with AI code generation and debugging capabilities, and the built-in ability to use SQL on your Python DataFrame, you can quickly create multiple plots out of a given DataFrame. You can also easily slice your visualizations by various dimensions using Python-based visualization libraries like seaborn, matplotlib and plotly.

Using both of these tools together made the critical tasks of data loading and data exploration much easier for a data scientist or analyst by automating much of the upfront data preparation steps!

🎆Analytical Conclusion; Leave women in dangerous situations for extended periods of time and they’ll begin to justify the violence committed against themselves!

The data we explored in the plots above demonstrated that women often justify violent acts committed against themselves almost as equally as men do. Particularly, women who are less educated are more likely to fall into the shackles of these beliefs when compared to their more educated counterparts.

Additionally, the data also shows us women who are less educated have less input on the fate of their personal health. Thus, misogyny is often internalized and condoned by women themselves, especially by those who are less educated. It is not enough to be kinder toward women—we need to advocate for their education to be able to fight the sexism and prejudice that often start within women themselves.


P.S. If you want to explore this notebook on your own, then here’s the link to it!

· 8 min read
Adrian Brudaru

tl;dr: You can kick off dbt jobs from Python - either by wrapping dbt Core, or by wrapping the Cloud API. But why should you use one over the other, and how to best do it to keep things simple?

Outline:

  1. What is dbt, and what’s the use case for Core and Cloud?

    • The Problem dbt Solves
    • What is dbt Core?
    • What is dbt Cloud?
    • When to Use One or the Other
    • Use Cases of dbt Cloud Over Core
  2. What are the use cases for running dbt core or Cloud from Python?

    • Case 1: Analytics Engineering and Data Engineering Teams
    • Case 2: Real-time Data Processing and Analytics
    • Case 3: Avoiding Library Conflicts
  3. Introducing dlt’s dbt runners - how the Extract and Load steps can trigger the Transform.

    • The Cloud runner
    • The Core runner
  4. A short demo on how to do that with dlt’s dbt runner.

    • dbt Cloud Runner Demo
    • dbt Core Runner Demo

1. What is dbt, and what’s the use case for Core and Cloud?

dbt (data build tool) is an open-source software that plays a crucial role in the data transformation process. It empowers data analysts and engineers to create, manage, and document data transformation workflows using SQL (Structured Query Language). dbt primarily focuses on solving the transformation aspect in ELT (Extract, Load, Transform) data processing.

The Problem dbt Solves

dbt addresses the challenge of efficient data transformation, streamlining the 'Transform' stage in ELT workflows. Traditionally, transforming raw data into a structured, analyzable format has been complex and laborious. dbt simplifies and automates this process, allowing users to define data transformations through SQL queries.

What is dbt Core?

dbt Core is the fundamental open-source version of dbt. It provides the essential features and functionalities for developing and running data transformation workflows using SQL scripts. dbt Core offers local execution capabilities, making it suitable for small to medium-scale projects run within a user's environment.

What is dbt Cloud?

dbt Cloud is a cloud-based platform provided by Fishtown Analytics, the company behind dbt. dbt Cloud offers a managed environment for running dbt, providing additional features and capabilities beyond what dbt Core offers. It is hosted on the cloud, providing a centralized, collaborative, and scalable solution for data transformation needs.

When to Use One or the Other?

The choice between dbt Core and dbt Cloud depends on various factors, including the scale of your data transformation needs, collaboration requirements, and resource constraints.

  • Use dbt Core:
    • For small to medium-sized projects.
    • When you prefer to manage and execute dbt locally within your environment.
    • If you have specific security or compliance requirements that necessitate an on-premises solution.
  • Use dbt Cloud:
    • For larger, enterprise-scale projects with significant data transformation demands.
    • When you require a managed, cloud-hosted solution to reduce operational overhead.
    • If you value collaborative features, centralized project management, and simplified access control.

But, dbt Core is free and open source, where dbt Cloud is paid. So let’s look into why we would use the paid service:

Use Cases of dbt Cloud Over Core

We could summarize this as: Cloud is the best solution if your Analytics engineer team wants analytics engineer specific tooling and does not want to concern itself with data-engineer specific tooling.

  1. Scalability and Performance: dbt Cloud provides seamless scalability to handle large-scale data transformation workloads efficiently.
  2. Collaboration and Team Management: dbt Cloud offers centralized project management and collaboration features, enhancing team productivity and coordination.
  3. Automated Task Scheduling: dbt Cloud allows for automated scheduling of dbt jobs, streamlining data transformation processes.
  4. Easy Integration with Cloud Data Warehouses: dbt Cloud integrates seamlessly with various cloud data warehouses, facilitating simplified setup and configuration.

So dbt Cloud is kind of like a standalone orchestrator, IDE and more.

2. What are the use cases for running dbt Core or Cloud from Python?

Case 1: You have an Analytics engineering team and a data engineering team that work with different tools.

This is a normal case to have in an enterprise teams, where we have a clear separation of responsibilities and tooling based on team preferences and competencies.

In this case, the Analyics Engineering team will use dbt Cloud for its convenient features, making them more effective.

However, the Data Engineers will want to ensure that the dbt models only run after new data has been loaded - not before, not after, and not at all in case the data did not load. So how to coordinate this?

To avoid race conditions, or dbt starting despite a broken loading pipeline, the data engineer needs to be able to trigger the dbt run and wait for it.

Of course, this is a case for the dbt Cloud runner.

Case 2: Real-time Data Processing and Analytics

In scenarios where you require real-time or near real-time data processing and analytics, integrating dbt with Python allows for dynamic and immediate transformations based on incoming data.

If you only refresh data once a day, you do not need the runners - you can set the loads to start at midnight, and the transforms to start at 7 AM. The hours in between are typically more than enough for loading to happen, and so you will have time to deliver the transformed data by 9 AM.

However, if you want to refresh data every 5, 15, 60 minutes or something similar, you will want to have fine grained control over calling the transform after loading the new increment.

Such, we have to be able to kick off the dbt job and wait for it, before starting the next refresh cycle.

Here, both the dbt Cloud and Core runners would fit.

Case 3. Avoiding Library conflicts between dbt Core and run environment.

If you are running dbt from some orchestrators, such as Airflow, you might find that you cannot, because installing dbt causes library conflicts with the base environment.

In such cases, you would want to create a venv or run the job off the orchestrator.

Such, both the Cloud runner and the Core runner with virtual env would fit well here.

3. Introducing the dbt runners we have created in open source

Here at dlt we solve the EL in the ELT - so naturally we want to kick off dbt to solve the T.

dlt is an open source library made for easily building data pipelines for Python first people.

The dlt library auto cleans data and generates database-agnostic schemas before loading - so regardless of which database we use, our schema is the same. This provides a unique opportunity to standardise dbt packages on top using cross db macros.

So let’s look at the 2 runners we offer:

The Cloud runner

Docs link: dbt Cloud runner docs.

The Cloud runner we support can do the following:

  • Start a dbt job in your dbt Cloud account, optionally wait for it to finish.
  • Check the status of a dbt job in your account.

Code example:

from dlt.helpers.dbt_cloud import run_dbt_cloud_job

# Trigger a job run with additional data
additional_data = {
"git_sha": "abcd1234",
"schema_override": "custom_schema",
# ... other parameters
}
status = run_dbt_cloud_job(job_id=1234, data=additional_data, wait_for_outcome=True)
print(f"Job run status: {status['status_humanized']}")

Read more about the additional data dbt accepts in their docs.

The core runner

Docs link: dbt Core runner docs.

The core runner does the following:

  • Run dbt core from a local or repository package path.
  • Set up the running:
    • Optionally install a venv.
    • Install dbt if not exists.
    • Copy over the remote package.
    • Inject credentials from dlt (which can be passed via env, vaults, or directly).
    • Execute the package and report the outcome.

Code example:

# Create a transformation on a new dataset called 'pipedrive_dbt'
# we created a local dbt package
# and added pipedrive_raw to its sources.yml
# the destination for the transformation is passed in the pipeline
pipeline = dlt.pipeline(
pipeline_name='pipedrive',
destination='bigquery',
dataset_name='pipedrive_dbt'
)

# make or restore venv for dbt, using latest dbt version
venv = dlt.dbt.get_venv(pipeline)

# get runner, optionally pass the venv
dbt = dlt.dbt.package(
pipeline,
"pipedrive/dbt_pipedrive/pipedrive",
venv=venv
)

# run the models and collect any info
# If running fails, the error will be raised with full stack trace
models = dbt.run_all()

# on success print outcome
for m in models:
print(
f"Model {m.model_name} materialized" +
f"in {m.time}" +
f"with status {m.status}" +
f"and message {m.message}")

4. A short demo on how to do that with dlt’s dbt runner.

dbt Cloud runner

In this example, we start from the Pokemon API, load some data with dlt, and then kick off the dbt run in our dbt Cloud account.

GitHub repo: dbt Cloud runner example.

dbt Core runner

In this example, we copy GA4 events data from BigQuery into DuckDB, and run a dbt package to calculate metrics.

Article: BQ-dlt-dbt_core-MotherDuck.

Accompanying GitHub repo: dbt Core runner example.

In conclusion

Running dbt from Python is an obvious necessity for a data team that also uses Python for ingestion, orchestration, or analysis. Having the 2 options to run Cloud or Core versions of dbt enables better integration between the Transform component and the rest of the data stack.

Want more?

This demo works on codespaces. Codespaces is a development environment available for free to anyone with a Github account. You'll be asked to fork the demo repository and from there the README guides you with further steps.
The demo uses the Continue VSCode extension.

Off to codespaces!

DHelp

Ask a question

Welcome to "Codex Central", your next-gen help center, driven by OpenAI's GPT-4 model. It's more than just a forum or a FAQ hub – it's a dynamic knowledge base where coders can find AI-assisted solutions to their pressing problems. With GPT-4's powerful comprehension and predictive abilities, Codex Central provides instantaneous issue resolution, insightful debugging, and personalized guidance. Get your code running smoothly with the unparalleled support at Codex Central - coding help reimagined with AI prowess.